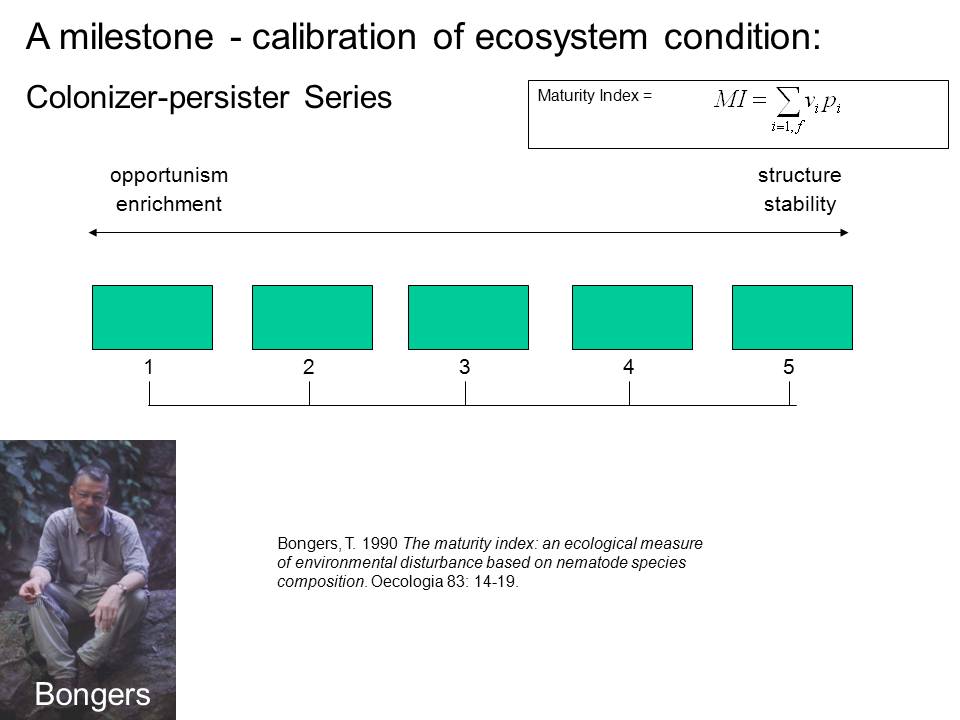
For calculation of maturity indices, soil nematodes are categorized into a 1-5 colonizer-persister series; range from extreme r- to extreme K-strategists. “Colonizer” nematodes at the lower end of the c-p scale are considered enrichment opportunists and therefore indicate resource availability; ‘persister’ nematodes at the high end of the scale indicate system stability, food web complexity and connectance.
|
|
|
Each
nematode taxon, usually at family level, is
classified
into one of the five c-p classes. Genera and species within a taxon have the
same c-p value as their family, or genus in the case of some marine taxa. For
the terrestrial and freshwater taxa, the following groups can be distinguished:
c-p1.
Nematodes with a short generation time and a large proportion of the body
occupied by gonads which produce many small eggs. Population growth under
food-enriched conditions is explosive. The nematodes are primarily bacterial
feeders with high metabolic activity. They are tolerant of pollutants and of
products of organic matter decomposition. These enrichment opportunists form
dauerlarvae when microbial biomass and activity decreases.
c-p2.
Nematodes with a short generation time and relatively high reproduction rates,
although lower than those in c-p1, consequently, they are slower to respond to
environmental enrichment than c-p1 nematodes. These nematodes do not form
dauerlarvae and occur in all environments, including those in which resources
are abundant and those in which resources are scarce. They are very tolerant of
pollutants and other disturbances. They include bacterial feeders, fungal
feeders and a few predators.
c-p3.
Nematodes with longer generation time than c-p2 nematodes and greater
sensitivity to disturbances. They include bacterial feeders, fungal feeders and
some predators.
c-p4.
Small dorylaims and the large non-dorylaimids with a low ratio of gonad to body
volume. These nematodes are characterized by a long generation time, permeable
cuticle and high sensitivity to pollutants. The non-carnivorous nematodes in
this group are relatively sessile whereas the carnivores actively seek prey. The
group is composed of larger carnivores, smaller omnivores and some bacterial
feeders.
c-p5.
Large dorylaimid nematodes with a long life span, low reproduction rates, low
metabolic activity and slow movement. The gonads are small relative to the body
volume and produce a small number of large eggs. They have a permeable cuticle
and are very sensitive to pollutants and other disturbances. This group is
composed of the larger omnivores and predators.
As recognized early in the development of the c-p series (Bongers, 1990; Bongers et al., 1991), a c-p classification at the genus or species level would be more informative. However, early attempts to assign c-p values at the genus level (Bongers et al., 1989) proved difficult due to lack of information on the biology and sensitivity of the individual genera. Consequently, family level assignments to c-p classes were used in the formal introduction of the MI (Bongers, 1990).
Calculation
and Use of the Maturity Index Family
All the
indices are based on the weighted proportion of nematodes in the fauna that meet
the index criteria.
A generic formula for calculation of indices in the MI family is:
![]() , where XI is the index of interest,
vi is the
colonizer-persister (c-p) value assigned to taxon
i, and
ni
is the number of nematodes in each of the
f taxa that meet the criteria of the
index.
, where XI is the index of interest,
vi is the
colonizer-persister (c-p) value assigned to taxon
i, and
ni
is the number of nematodes in each of the
f taxa that meet the criteria of the
index.
MI:
the Maturity Index is based on non-plant-feeding taxa and considered a measure
of environmental disturbance; low MI values indicate a disturbed and/or enriched
environment, high MI values a stable environment (Bongers, 1990). In essence,
the MI is an ecological indicator of the state of succession of a system whereby
disturbance and its consequent enrichment effects result in a setback of
succession to an earlier state (Odum, 1985). In the case of the nematode
assemblage, the successional setback is reflected in a lower MI (Bongers
et al., 1997).
The dauerlarvae of enrichment opportunists, animal parasites such as mermithids, and entomopathogenic nematodes are excluded from the calculation of MI (Bongers & Bongers, 1998) as their presence does not provide information about the present functioning of the soil food web.
PPI:
the Plant-Parasite Index,
is comparable to the MI but computed only for the plant-feeding nematodes with
the rationale that their abundance is determined by the vigor of their host
plants which, in turn, is determined by system enrichment. Consequently, under
nutrient poor conditions of natural ecosystems, often associated with a high
proportion of Tylenchidae (c-p2) in the nematode assemblage, the PPI is lower
than under enriched agricultural conditions, the inverse of the response of the
MI to enrichment
(Bongers,
1990; Bongers et al., 1997).
The reports that Filenchus misellus
feeds on fungi (Brzeski, 1998; Okada et
al., 2002; 2005) underscores the need for further study on the feeding
habits of the many genera and species in this ubiquitous Tylenchidae.
PPI/MI:
The PPI/MI ratio is lower under nutrient poor conditions than under nutrient
rich conditions. It is a sensitive indicator of enrichment in agroecosystems
(Bongers & Korthals, 1995; Bongers et al.,
1997).
MI2-5:
is identical to the MI but excludes the c-p1 enrichment opportunists. The index
was derived during studies of the relationship between MI and copper
concentration under agricultural conditions. In those studies, it was apparent
that there was a strong relationship between decrease in higher c-p value
nematodes and pollution-induced stress while the c-p1 nematodes responded to the
presence of decomposing organic material. In some cases, the pollutant may
become a resource for a component of the microbial community which, in turn,
acts as a resource for the c-p1 nematodes. The MI2-5 was first discussed at the
Crop Protection Symposium in
ΣMI:
was proposed by Yeates (1994) and is equivalent to the Total MI of Wasilewska
(1994). The index is the MI for all nematodes in the system, including plant
feeders, based on the assertion that the complete assemblage provides integral
information with regard to disturbance and environmental condition. If a soil
ecosystem receives nutrient input, opportunistic bacterial- and fungal-feeding
nematodes respond rapidly to the corresponding increase in their resources.
Plant parasites do not respond in the short term but may increase later as a
result of higher plant vigor. Since many are c-p3 or higher, the expected
decrease of MI in response to enrichment is offset by inclusion of plant
parasites in ΣMI. Further, many plant feeders, such as the c-p3 Pratylenchidae,
are tolerant of pollutant stress (Korthals
et al., 1996a,b) which, in ΣMI,
offsets the impact of pollution registered by the MI or MI2-5 Bongers, 1999;
Bongers & Bongers, 1998).
ΣMI2-5:
computes the MI for all nematodes in the c-p2-5 range (Neher & Campbell, 1996).
The index recognizes that the higher c-p value plant-feeding species also
provide information of environmental stress but bears some of the burden of the
ΣMI in situations of nutrient enrichment.
Sometimes the Maturity Index has been expressed as
![]() , which has leads to
miscalculations. The errors commonly arise when the proportions of all taxa
present are calculated in a spreadsheet, as for the calculation of ΣMI, and then
the same proportions, excluding those that are not relevant, are used to
calculate incorrectly the other indices in the family. To obtain the correct
index values, it is necessary to recalculate the proportions to be weighted with
respect to the total number of nematodes in the sample which meet the specific
criteria of each index.
, which has leads to
miscalculations. The errors commonly arise when the proportions of all taxa
present are calculated in a spreadsheet, as for the calculation of ΣMI, and then
the same proportions, excluding those that are not relevant, are used to
calculate incorrectly the other indices in the family. To obtain the correct
index values, it is necessary to recalculate the proportions to be weighted with
respect to the total number of nematodes in the sample which meet the specific
criteria of each index.
Indicators of Ecosystem Function: Enrichment Index, Structure Index, Basal Index and Channel Index
The evolution of concepts, research and model validation associated with
development of the Maturity Index Family led to a functional guild
classification of nematodes as a basis for studying and comparing ecosystem
processes (Bongers & Bongers, 1998;
Bongers
& Ferris, 1999). The functional redundancy
represented in the diversity of nematode faunae creates a high probability
that the absence of a guild is a reliable indicator of disturbance and that
the presence of a guild is a reliable indicator of lack of perturbation or
of recovery from perturbation. In the case of organic enrichment of soil,
opportunistic guilds (r-strategists)
respond reliably (Sánchez Moreno
et al., 2006). Considering
soil nematode taxa as representatives of functional guilds generates an
indicator profile that is not constrained by population distribution
patterns and microenvironment effects (Ferris & Bongers, 2006).
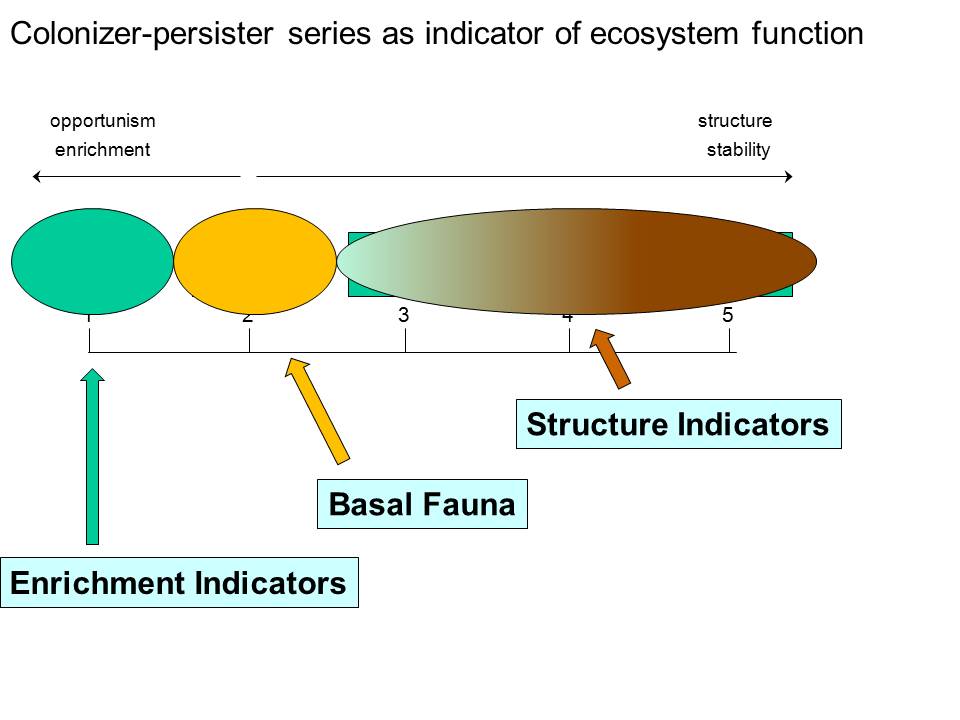
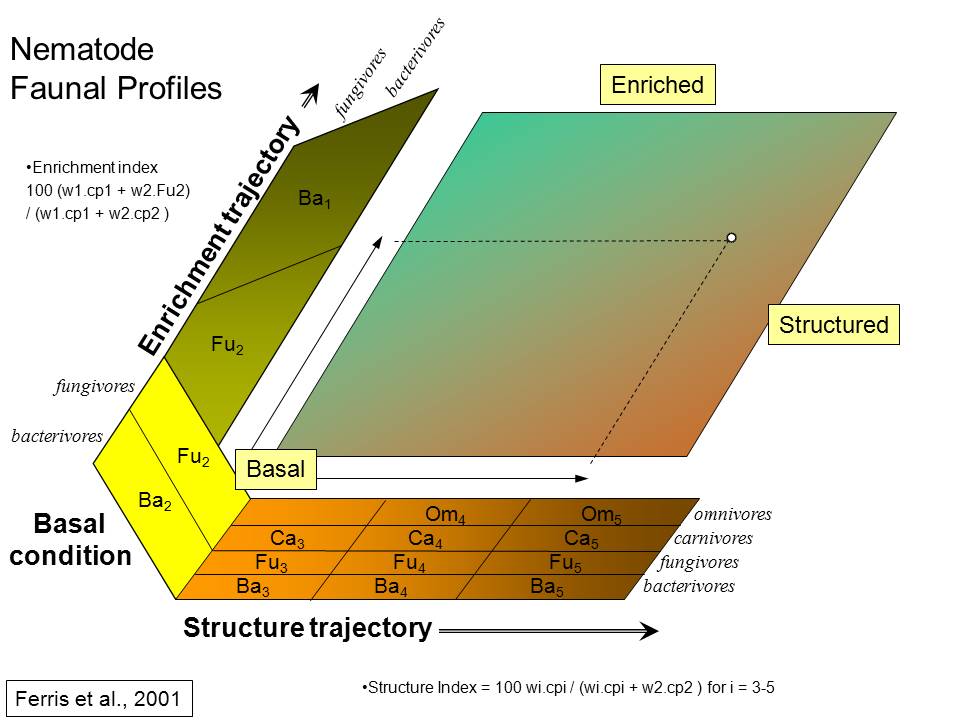
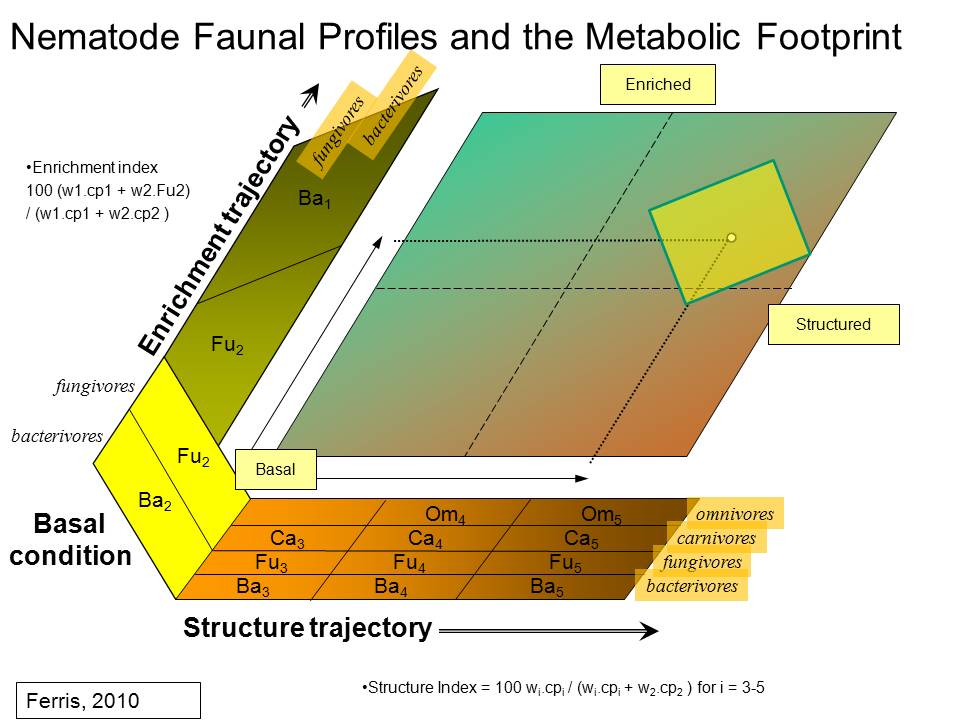
The Enrichment Index and the Structure Index, both based on the indicator
importance of functional guilds of nematodes, are descriptors of food web
condition. Functional guilds are defined as a matrix of nematode feeding
habits with the biological, ecological and life history characteristics
embodied in the c-p classification. Thus, the Ba3 functional guild comprises
c-p3 bacterivores such as those in the Teratocephalidae or Prismatolaimidae.
Nematodes of all feeding habits classified as c-p2 are considered basal (b)
to both enrichment and structure trajectories. Bacterial-feeding c-p1 and
fungivores in c-p2 are indicators of enrichment (e) while nematodes of all
feeding habits in c-p3-5 are indicators of structure (s). Functional guild
indicators are weighted according to growth and metabolic rates (resource
utilization) on the enrichment axis, and according to estimates of the
degree of connectance, as determined by
numbers of nematodes in higher c-p classes, in food webs of increasing
complexity . Greater detail on derivation of the structure and enrichment
weightings (Wi)
is provided in
Ferris et al., 2001.
The nematode fauna is comprised of basal, enrichment and structural
components (b,e,s):
The Enrichment (EI), Structure (SI), Basal (BI), and Channel (CI) indices
are calculated from the weighted faunal components (Ferris
et al., 2001,
Berkelmans et al., 2003):
Similarly to the
MI (Bongers & Bongers, 1998), the
EI and CI are calculated excluding dauerlarvae to provide an index of the
present state of the system. Rather than proliferate indices calculated with
and without dauerlarvae, we consider that the ratio of dauerlarvae to active
forms, as proposed by Sohlenius (1969, 1973),
provides a clear metric of resource availability to functional guilds of
bacterivores and fungivores. When the proportion of dauerlarvae is low, the
resource supply is probably stable; when it is high, the system is probably
in a state of resource-driven succession from bacterial to fungal domination
of decomposition channels. However, considering the short life-span of many
enrichment opportunist nematodes (Ferris
et al., 1996a), frequent sampling
will be necessary for using such calculations to model resource flow rates
through the lower levels of
the soil food web.
 |
 |
||||||||||||||||||||||||||||||
|
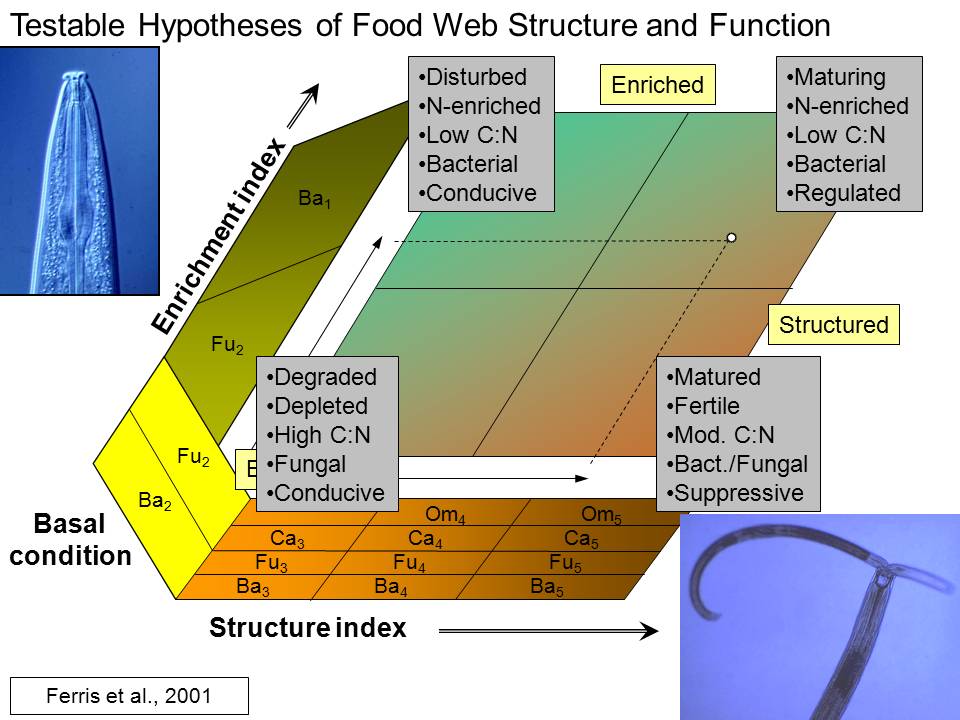
Inferred
condition of the soil food web and its environment based on weighted
nematode faunal analysis. Quadrats refer to faunal ordination in the
faunal profile (from Ferris
et al., 2001).
|
Abundance and Biomass
The indices developed from nematode faunal analysis are all based on proportions of the faunae in various functional guilds. They provide indication of the relative proportions of services and functions, but not of their magnitude. The biomass or abundance of organisms in various functional guilds must be important in determining the magnitude of services.
The metabolic footprint considers that resources assimilated by organisms are partitioned into a production component and a respiration component.
The production component is the lifetime amount of C
partitioned into growth and egg production and the respiration component
assesses C utilization in metabolic activity.
The formulae of de Man (1884) have
been the standard morphometric descriptors for nematode taxa for over 50 years
(Thorne,1961). Among the standard parameters are
L,
the body length, and
a, the ratio of length to maximum body
diameter. Thus, from information available in the taxonomic descriptions of
nematode species, the formula for nematode volume is restated as V = (L3/a2)/1.7.
To calculate the weight of nematodes, Andrássy (1956) determined their specific
gravity as 1.082-1.086 (average 1.084) from the specific gravity of liquids in
which they neither rose nor sank. From the product of specific gravity and
volume, he determined the weight (W)
of a nematode in terms of
L and
D.
The formula can be rewritten to reflect available parameters as W = (L3/a2)/(1.6*106)
μg.
Using these data, nematode ecophysiological parameters can be calculated at various taxonomic and functional levels of resolution.
The nematode weight
data are calculated from the body lengths and widths of adult nematodes;
however, but all individuals present in a sample are unlikely to be in the adult
stage at the same time. If we assume that nematodes continue to assimilate
resources at a rate indicated by their maximum body mass but, at some stage in
their development, switch to partitioning assimilates into egg production rather
than body structure, the biomass data, adjusted for life course duration,
represents the rate of C utilization and the production component of the
metabolic footprint..
Nematodes of different taxa complete
their life courses at different rates. Opportunistic r-strategists in the cp-1
category may complete the life course in as little as 8 days (e.g.
Caenorhabditis elegans)
while those in the cp-5 category may have a life course of several months
[9,17]. In reality, the life courses of larger nematodes in cp classes 3-5 are
not well known but, based on estimated longevity and body size and fecundity
rates inferred by the cp classification [16], I assume an approximately linear
relationship between life course duration and cp-class. Then, to normalize the
amount of C utilized in production for turnover rate, I divide through by the cp
value of each nematode group to weight production (P)
by the inverse of the life cycle length of the component taxa. Using the
estimated dry weight of nematodes as 20% of fresh weight and the proportion of C
in the body as 52% of dry weight [27,28], the weight of C is 0.1 of body fresh
weight and Pt = 0.1Wt/mt
where Pt,
Wt
and mt
are, respectively, the C used in production, the body weight, and the cp class
of taxon t.
The Respiration
Component
For each nematode species, the
c
values of the relationship R = cWb,
where b = 0.75, increase to maxima at soil temperatures between 20 and 30°C and
declines at higher temperatures [18]. For current purposes, I make the somewhat
heroic assumption that all species present in the same environment are similarly
adapted to ambient conditions and that the
c
values of the relationships between respiration rates and body weight change
similarly with temperature. Consequently, the species and temperature-specific
coefficient c
is omitted from the respiration-body weight relationship and the aggregate
respiration rate is calculated as ΣR = NtW
0.75, where
Nt
is the number of individuals in each of the
t
taxa of interest.
Since we may be more interested in
resource availability and C flow through the food web than CO2
evolution, the weight of lifetime C mineralized by each taxon and, by summation,
by each functional guild or the complete nematode assemblage, is derived from
the molecular weights of C and O2.as
12/44 or 0.273 of the mass of CO2
evolved.
The Metabolic
Footprint Calculation
The expanded equation for the
metabolic footprint of nematodes (F),
as an index of C-utilization of component taxa, is the sum of the production and
respiration components, F = P+R, and expanded as: F = Σ(Nt(0.1(Wt/mt)+0.273(Wt
0.75)))
for each of the
t
taxa involved in the summation. Then, from the formula of Andrássy
[1] and the L
and a
values each nematode species, the
Wt
parameter can be replaced by (L3/a2)/(1.6*106).
Metabolic
Footprints of
Form and Function
The metabolic
footprint is an estimator of nematode contribution to various ecosystem services
and functions:
The
Enrichment Footprint
is the metabolic footprint of those nematodes most rapidly responsive to
resource enrichment;
The
Structure Footprint
is the metabolic footprint of higher trophic levels which may
have a regulatory function in the food web and which are indicative of the
abundance of organisms of similar functions in non-nematode taxa [16,30];
The
Functional Footprint
is the total area of the two functional footprints (enrichment and structure) as
illustrated in Figs 1 and 2;
The
Herbivore, Bacterial
and
Fungal Footprints are based on the nematode indicators
of C and energy entering the soil food web through their respective channels;
The
Aggregate Footprint
is the metabolic footprint of the complete nematode assemblage, regardless of
trophic role or ecosystem function.
For
graphic display of the metabolic footprint for enrichment and structure
indicators
 |
|
The functional metabolic
footprint is maximized when the rhomboid shape becomes a square and one might
consider, as a working hypothesis, that the productivity and turnover rates of
the enrichment indicators, representative of the prey, are sufficient to
maintain the needs of the predators (the structure indicators) so that the
system is in metabolic balance.
The characteristics of the metabolic
footprints are visually comparable within each faunal analysis chart. They may
not be comparable between charts, except for comparisons of the ratios of
enrichment and structure components, because of differences in the units of the
data from which they are derived, differences in the
k
scalar used, and differences in nematode extraction methods, taxonomic
resolution, and other sources of variation among datasets.
The evolution of functional indices based on
nematode faunal analysis provides insights into functioning and services of
ecosystems. It has been greatly advanced by inference and observation of
nematode feeding habits in relation to stomal architecture and by knowledge of
the life history traits of nematode functional guilds. Undoubtedly, refinement
and fine-tuning of the system is warranted and will occur as further information
is developed on feeding habits and life history traits and the assignment of
taxa to functional
guilds.
There are other examples of the use of the community
structure of various organism groups for environmental monitoring. The advantage
of those based on nematode functional guilds derives from the abundance and
ubiquity of nematodes, the relationships between form and function, the
differences among families in sensitivity to environmental disturbance, and the
ease with which nematodes can be separated from substrate and categorized into
taxonomic groups or functional guilds.
Andrássy, I. (1956) Die rauminhalst and gewichtsbestimmung der fadenwurmer,
(Nematoden),
Acta Zoologica Academi Sciences, Hungary 2: l-15.
Apple, M.S., M.A.
Korostyshevskiy. (1980) Why many-biological parameters are connected by power
dependence,
J. Theor. Biol. 85: 569-573.
Atkinson, H.J. (1980).
Respiration in nematodes, in: B.M. Zuckerman (Ed.)
Nematodes as Biological Models, Vol. 2,
Academic Press, New York,. pp. 116-142.
Berkelmans, R., Ferris, H.,
Tenuta M., and Bruggen, A.H.C. van (2003) Effect of long-term crop management on
nematode trophic levels other than plant feeders disappear after one year of
disruptive soil management. Applied Soil
Ecology 23, 223-235
Bongers, T. (1988) De
Nematoden van Nederland. Pirola, Schoorl.
Bongers, T. and Bongers, M. (1998) Functional diversity of
nematodes. Applied Soil Ecology 10,
239-251.
Bongers, T. and Ferris, H.
(1999) Nematode community structure as a biomonitor in environmental monitoring.
Trends in Ecology and Evolution 14,
224-228
Bongers, T. and Korthals, G. (1993) The Maturity Index, an instrument to monitor
changes in the nematode community structure.
Summaries of the 45th
International Symposium on Crop Protection, May 4, 1993. Ghent, Belgium. 80.
Bongers, T. and Korthals,
G. (1995) The behavior of MI and PPI under enriched conditions.
Nematologica 41 (3), 286.
Bongers, T., Alkemade, R. and Yeates, G.W. (1991) Interpretation of
disturbance-induced maturity decrease in marine nematode assemblages by means of
the Maturity Index. Marine Ecology
Progress Series 76, 135-142.
Bongers, T., Goede, R.G.M. de, Kappers, F.I. and Manger, R. (1989) Ecologische
typologie van de Nederlandse bodem op basis van de vrijlevende nematodenfauna.
RIVM-rapport 718602002.
Bongers, T., Goede, R.G.M. de, Korthals, G. and Yeates, G.W. (1995) Proposed
changes of c-p classification for nematodes.
Russian Journal of Nematology 3,
61-62.
Bongers, T., van der Meulen, H. and Korthals, G. (1997). Inverse
relationship between the nematode maturity index and plant parasite index under
enriched nutrient conditions Applied Soil
Ecology 6, 195-199.
de Man, J.G. (1884). Die frei in der reinen Erde und im süssen-Wasser lebenden
Nematoden der niederländischen fauna. Eine systematische-faunistische
Monographie.
Leiden.
Ferris, H., and
Matute, M. M. (2003). Structural and functional succession in the
nematode fauna of a soil food web. Applied
Soil Ecology. 23, 93-110.
Ferris, H., and Bongers, T. (2006). Nematode indicators of organic enrichment. Journal of Nematology 38, 3-12.
Ferris, H., and Bongers, T. (2009).
Indices for
analysis of nematode assemblages, in: M. Wilson, T. Kakouli-Duarte (Eds.)
Nematodes as Environmental Biondicators. CABI,
Ferris, H., Bongers, T. and Goede, R. de (2004). Nematode faunal analyses to
assess food web enrichment and connectance. In R.C. Cook and D.J. Hunt (eds)
Proceedings of the Fourth International Congress of Nematology.
Nematology Monographs and Perspectives 2. Brill, Netherlands. 866p.
Ferris, H.,
Bongers, T. and
Goede, R.G.M. de (2001).
A framework for soil food web diagnostics:
extension of
the nematode faunal analysis concept.
Applied Soil Ecology 18, 13-29.
Ferris, H.,
Eyre, M., Venette, R. C., and S. S. Lau, S. S. (1996a)
Population energetics of bacterial-feeding nematodes: Stage-specific
development and fecundity rates. Soil
Biology and Biochemistry 28, 271-280.
Ferris, H.,
Venette, R. C., and Lau, S. S. (1996b). Dynamics of nematode communities in
tomatoes grown in conventional and organic farming systems and their impact on
soil fertility. Applied Soil Ecology
3, 161-175.
Ingham, R.E., Trofymow, J.A., Ingham, E.R. and Coleman D.C. (1985)
Interactions of bacteria, fungi, and
their nematode grazers: Effects on nutrient cycling and plant growth.
Ecological Monographs 55, 119-140.
Korthals, G.W., Ende, A.
van der, Megen, H. van, Lexmond, T.M., Kammenga, J.E. and
Bongers, T. (1996a) Short-term effects of cadmium, copper, nickel and
zinc on soil nematodes from different feeding and life-history strategy groups.
Applied Soil Ecology 4, 107-117.
Neher, D.A. and Campbell, C.L. (1996) Sampling for
regional monitoring of nematode communities in agricultural soils.
Journal of Nematology
28, 196-208.
Ruess, L. and Ferris, H. (2004).. Decomposition pathways and successional
changes. In R.C. Cook and D.J. Hunt (eds) Proceedings
of the Fourth International Congress of Nematology. Nematology Monographs and
Perspectives 2. Brill, Netherlands. 866p.
Sánchez Moreno, S. and Ferris.,H. (2007).
Suppressive service of the soil food web: Effects of environmental management.
Agriculture, Ecosystem and Environment
119, 75-87.
Sánchez Moreno, S., Minoshima, H., Ferris, H. and
Jackson, L.E. (2006)..
Linking soil properties and nematode community composition: effects of
soil management on soil food webs.
Nematology 8, 703-715.
Sohlenius, B. (1969) The
monoxenic cultivation of some rhabditid nematodes.
Oikos 20, 287-293.
Sohlenius, B. (1973)
Structure and dynamics of populations of Rhabditis (Nematodes: Rhabditidae) from
forest soil. Pedobiologia 13, 368-375.
Sohlenius, B. and Boström, S. (1984) Colonization, population
development and metabolic activity of nematodes in buried barley straw.
Pedobiologia 27, 67-78.
Thorne, G.
(1961). Principles of Nematology, McGraw-Hill. New York.
Yeates, G.W. (1979) Soil nematodes in terrestrial ecosystems.
Journal of Nematology 11, 213-229.
Yeates, G.W. (1994) Modification and qualification of the Nematode Maturity
Index. Pedobiologia 38, 97-101.
Yeates, G.W. (2003) Nematodes as soil indicators: functional and biodiversity
aspects. Biology and Fertility of Soils
37, 199-210.
Yeates, G.W., Bongers, T., Goede, R.G.M. de, Freckman, D.W. and Georgieva, S.S.
(1993) Feeding habits in soil nematode families and genera – an outline for soil
ecologists. Journal of Nematology 25,
315-331.
Zullini, A. (1976)
Nematodes as indicators of river pollution.
Nematologia Mediterranea
4, 13-22.