Contents |
Rev: 03/28/24 | |||
|
|
Fundamentals |
|
Design relative to Objectives | |
|
|
|
Defining Objectives |
|
Intensity and Precision |
| Return to Methodology Menu |
|
Biological/Ecological Considerations |
|
Risk |
|
|
|
Efficiency and Reliability |
|
Mechanics and Tools |
| Return to Management Utilities Menu |
|
Spatial Patterns |
|
Powerpoint presentation on sampling |
| Go to Nemaplex Main Menu |
1. Objectives should be clearly stated and
understood
2. Biology and ecology of pest known
3. Efficiency and reliability of method known
i) Determine presence or absence
a. assessment of long-term risk - perennials
b. virus-vectors
c. root crops - direct damage.
d. exotic pestsii) Determine population abundance - relative/absolute
a. predict potential yield/damage
b. assess rate of population change (+ or -)iii) Determine spatial patterns.
a. pattern of potential loss
b. partial treatment/management
i) Community structure and ecosystem analysis
a. foodweb structure and function
ii) Environmental impacts/quality /markers
a. effects of disturbance and contaminants
b. recovery from perturbationiii) Collections / surveys
a. faunal inventories
b. biodiversity studies
i) Life history strategies
a. feeding/parasitism
b. reproductive behavior
c. motility
d. energetics of system - influence on population
e. survival strategies.ii) Food distribution
a. crop spacing
b. root morphologyiii) Ecological requirements
a. moisture
b. temperature (magnitude and stability)
c. oxygeniv) Natural enemies
a. abundance and pattern
b. biology and aggressiveness.
i) Crop history, management, field usage
a. host status of previous crops
b. crop sequence
c. spatial arrangement of previous cropsii) Age of infestation
a. time to spread from a point source
iii) Edaphic conditions
a. soil texture patterns
iv) Drainage patterns
a. soil moisture levels
b. soil aeration
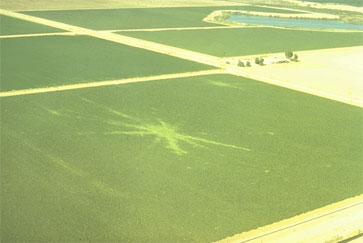
Avoid spreading through field by equipment. Photograph taken after land-leveling operations in a sugarbeet field in Imperial County, California. Source: I.J. Thomason
Consider objectives, biology/ecology, usefulness of information, acceptable precision, time, cost.
i) Organism moves to sampler
a. only over small distances in soil organisms
b. to roots of bioassay plants or to CO2 attractants.
ii) Sampler moves to organism
a. core sampling - aggregate samples
b. for monitoring changes through time, mark and sample at the same locations each time
c. symptom assessment, e.g. gall ratings - where possibleiii) Stratification - based on macrodistribution parameters
a. minimizes variance within each stratum
b. increases confidence in estimate of mean
c. population estimate more reflective of true population levels in each stratum
d. allows determination of spatial pattern
i) To maximize probability of achieving objectives
a. detect presence when populations highest
b. greatest precision when lowest? - but may be many misses!ii) To allow evaluation and management decision
a. prior to planting
b. end of growing season, following treatment, etc.
i) presence of one individual negatively affects presence of others - competition for a resource.
ii) variance < mean
i) presence of 1 individual does not influence others
ii) variance = mean
i) presence of one individual positively affects presence of others - reproductive, social behavior.
ii) variance > mean

Largest sample unit detects approximately the same number of objects each time it is placed in the sample arena. Repeated samples with the smallest sample unit have a high frequency of non detection.
Detection of presence/absence, spatial pattern, etc. Smallest sample unit provides information on spatial pattern but may require processing or analysis of a large number of samples. Largest sample unit provides no information on spatial pattern but always detects object if it is present in the sample arena.
i) Probability of zero (non-detection) at different population density and variance.
P(0)=(1+x/k)**(-k) k=0.5-1.0
for x=10, k=0.5 P(0)=0.22 (per liter)
for x=100, k=0.5 P(0)=0.07
 |
 |
| Note: k is the dispersion paramater of the negative binomial distribution |
i) Probability of overestimation of damage - smaller portion of field represented by mean or population densities above mean than portion represented by population levels below mean.
ii) Problem of comparing density or prominence of two species of different
distributioniii) Effect of compositing cores / sample units
a. reason for doing it - cost, time.
b. decrease in variance - mean ratio - the larger the sample, the more reliable - each composite sample more consistent.
c. note loss of information on spatial pattern, variability, etc.
d. One10-core sample in 5 acres covers only a 4-millionth of the soil surface.iv) Taylor's Power Law

a. effect of increasing cores per sample is to decrease a. Parameter b is relatively stable; is it a species characteristic?
b. variance vs population size
n=((t/D)2)(v/x2), where n is number of samples and x is population level.
D=SQRT((t2/n)(v/x2)) where D=half interval.
a. decreasing variance
b. increasing number of samples
c. increasing size of samples
but consider cost and logistics.
i) log axis, log axis
 |
|
ii) critical point models
a. utility based on time of management (preplant), and relatively low population volatility or motility.
iii) effect of increasing number of samples - root-knot nematodes on cotton example
v=a*mb ;
v=0.2*m2.2 ; n=((t/D)2)*(v/(m2))for 1 sample, t=12, D=SQRT((144/1)*(v/m2))
for 100 nematodes: for 500 nematodes:
v=5024 v=173286
relative yield for cotton: y=0.55+0.45*0.998(m-65)
| One sample per stratum; n=1, t=12 | ||
| Pi = 100 nematodes | Pi = 500 nematodes | |
| variance | 5024 | 173286 |
| Mean relative yield | 0.97 | 0.74 |
| D | 8.5 | 9.9 |
| Population range (2Dm) | 0 - 1700 | 0 - 9990 |
| Yield estimate range | 1 - 0.56 | 1 - 0.55 |
| Two sample per stratum; n=2, t=4.3 | ||
| Pi = 100 nematodes | Pi = 500 nematodes | |
| variance | 5024 | 173286 |
| Mean relative yield | 0.97 | 0.74 |
| D | 2.16 | 2.53 |
| Population range (2Dm) | 0 - 512 | 0 - 5060 |
| Yield estimate range | 1 - 0.71 | 1 - 0.55 |
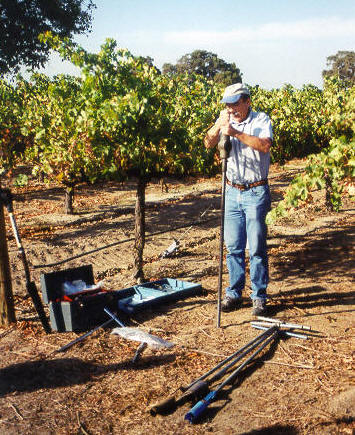
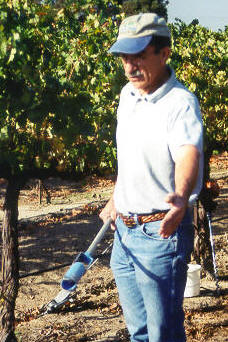
| Veihmeyer Sampling Tube | Soil Auger | Power Auger |
 |
 |
 |
9. Some Recommendations of Sampling Nematode Populations and Assemblages
A.
Where to sample
The most important consideration is
where the young, actively growing, feeder roots are likely to be. They are
likely to be most attractive to plant-feeding nematodes and the areas where a
lot of feeding and reproduction might take place.
So, here are things to consider:
In rain-fed systems (probably not many in CA), think of sampling at the
drip-line of the canopy but avoid areas that might be disked for weed control or
compacted by wheel traffic.
In sprinkler-irrigated systems, sample within the irrigated area, usually in the
tree row and avoiding compacted or tilled areas.
In drip systems, sample under drip emitters, selecting emitters that are about
the same distance from the tree trunk but within the canopy diameter of the
tree. Since the drippers are probably in the tree row, compaction is probably
not a problem.
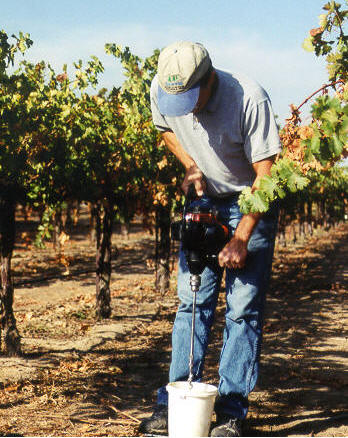
When you are making a composite samples of multiple cores of soil. I would try
to be consistent in the sampling site at each tree.
B.
How Deep to Sample
In the sampling areas I have described, I would take cores about 18 inches deep,
making sure that you are in a zone of actively-growing roots. But, in the case
that you want to determine all of the types of nematodes associated with a tree
or vine, or to obtain an estimate of their total abundance, it may be necessary
to sample to a depth of 5 feet or more. When sampling in a
sandy soil in Africa, I encountered nematodes of the genus Dolichodorus
at a depth of 12 feet under a deciduous tree and not any shallower in the soil
profile.
That depends on your objective. For
example, planning to apply a treatment or just trying to find areas where
plant-feeding nematodes are more abundant. Since nematode reproduction
rates are greater in warmer temperatures and when host plants are growing
vigorously, populations of plant-parasitic species are likely to be greatest in
late summer to early fall.. If you are trying to decide on a treatment or
planting schedule, late winter or early spring would work However,
population levels in spring should be related to those in the fall, so either
time would work.